Latest Results Highlights
The Latest Financial Results
FY March 2024 Full Year Financial Results was announced on May 10, 2024
FY March 2024 Full Year Results
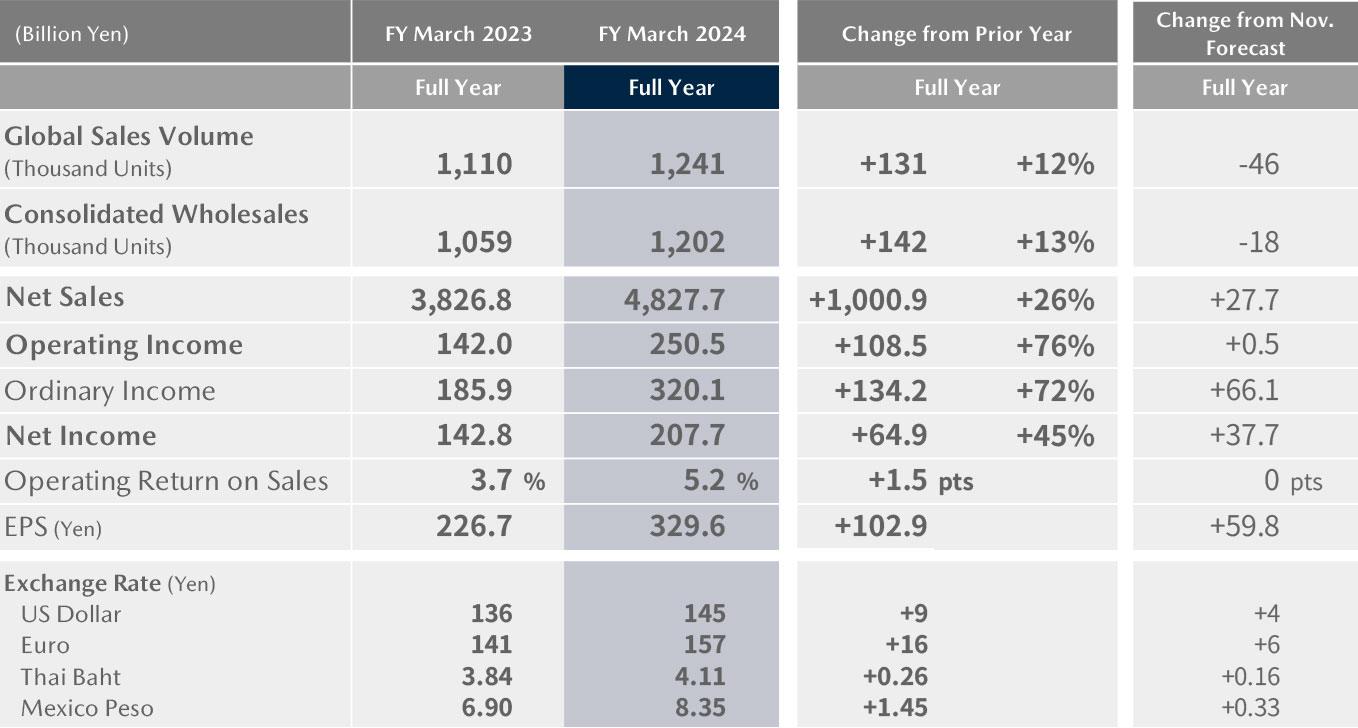
*Net income indicates net income attributable to owners of the parent
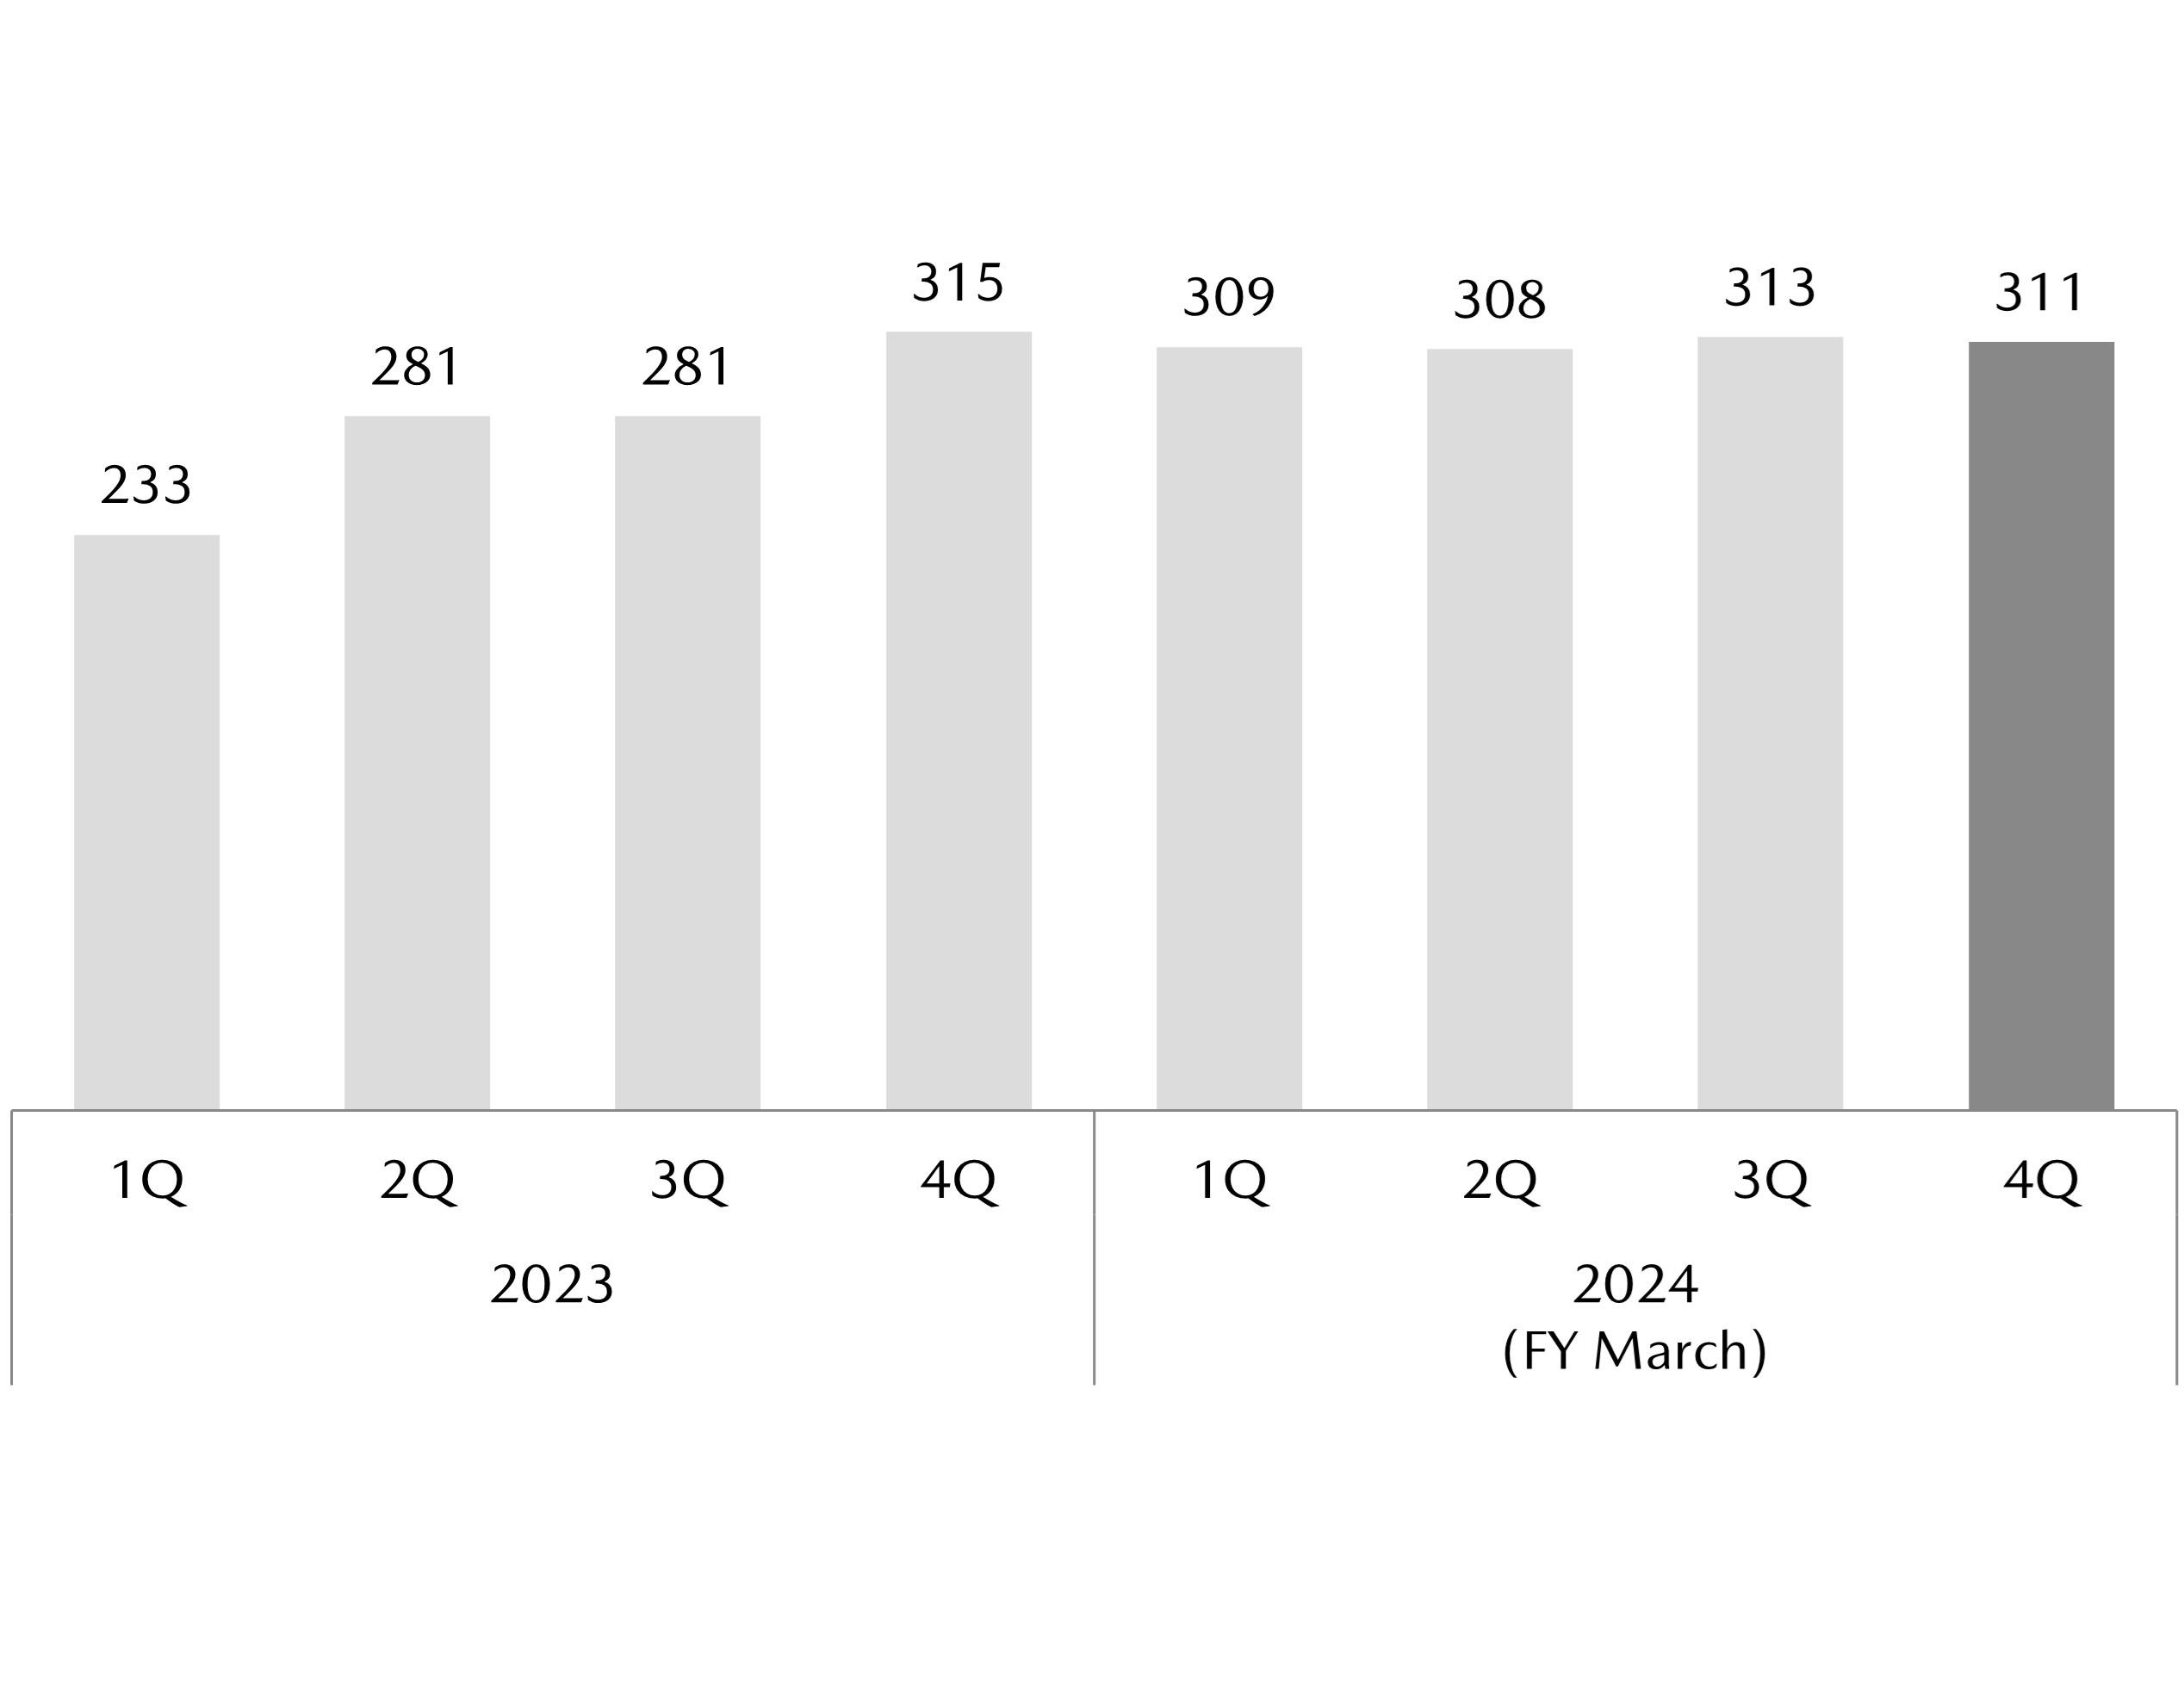
For the full year of fiscal year ended March 31, 2024 (April 1, 2023 through March 31, 2024), global sales volume was 1,241,000 units, up 12% year on year. In addition to strong performance in the U.S., growth in vehicle sales was driven by Large products, including the newly introduced CX-90 and the CX-50, which is manufactured at the Alabama plant in the U.S.
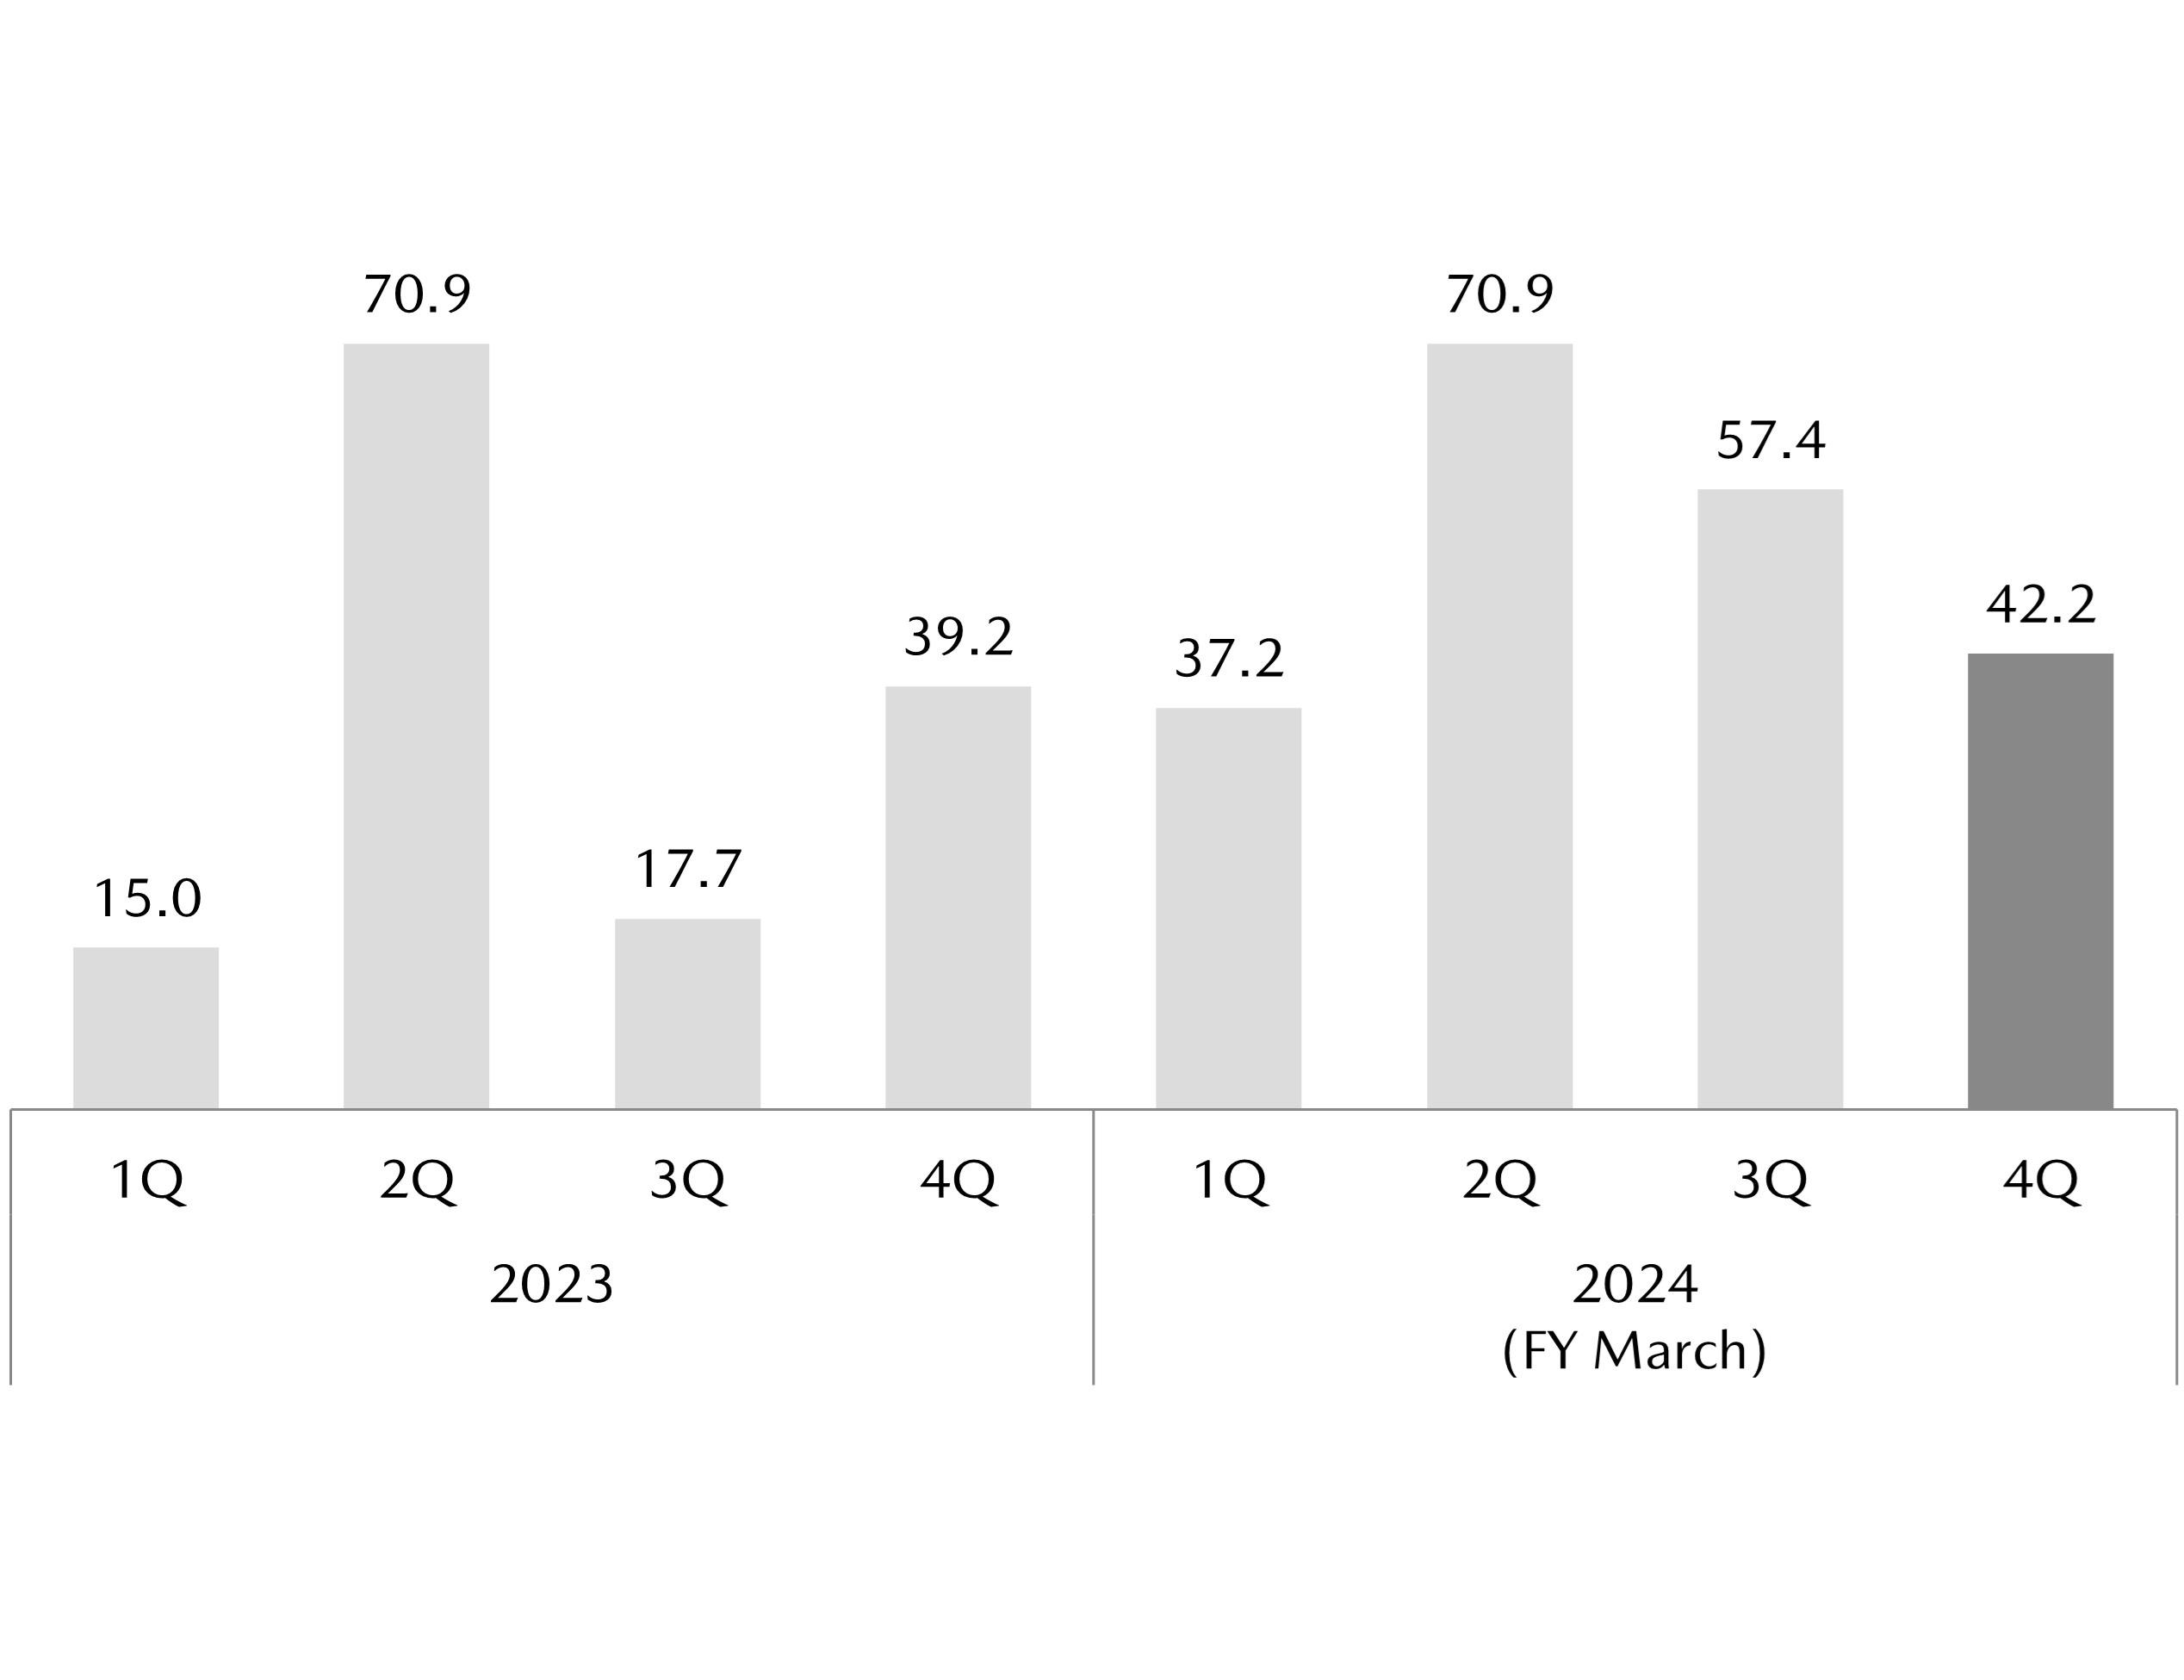
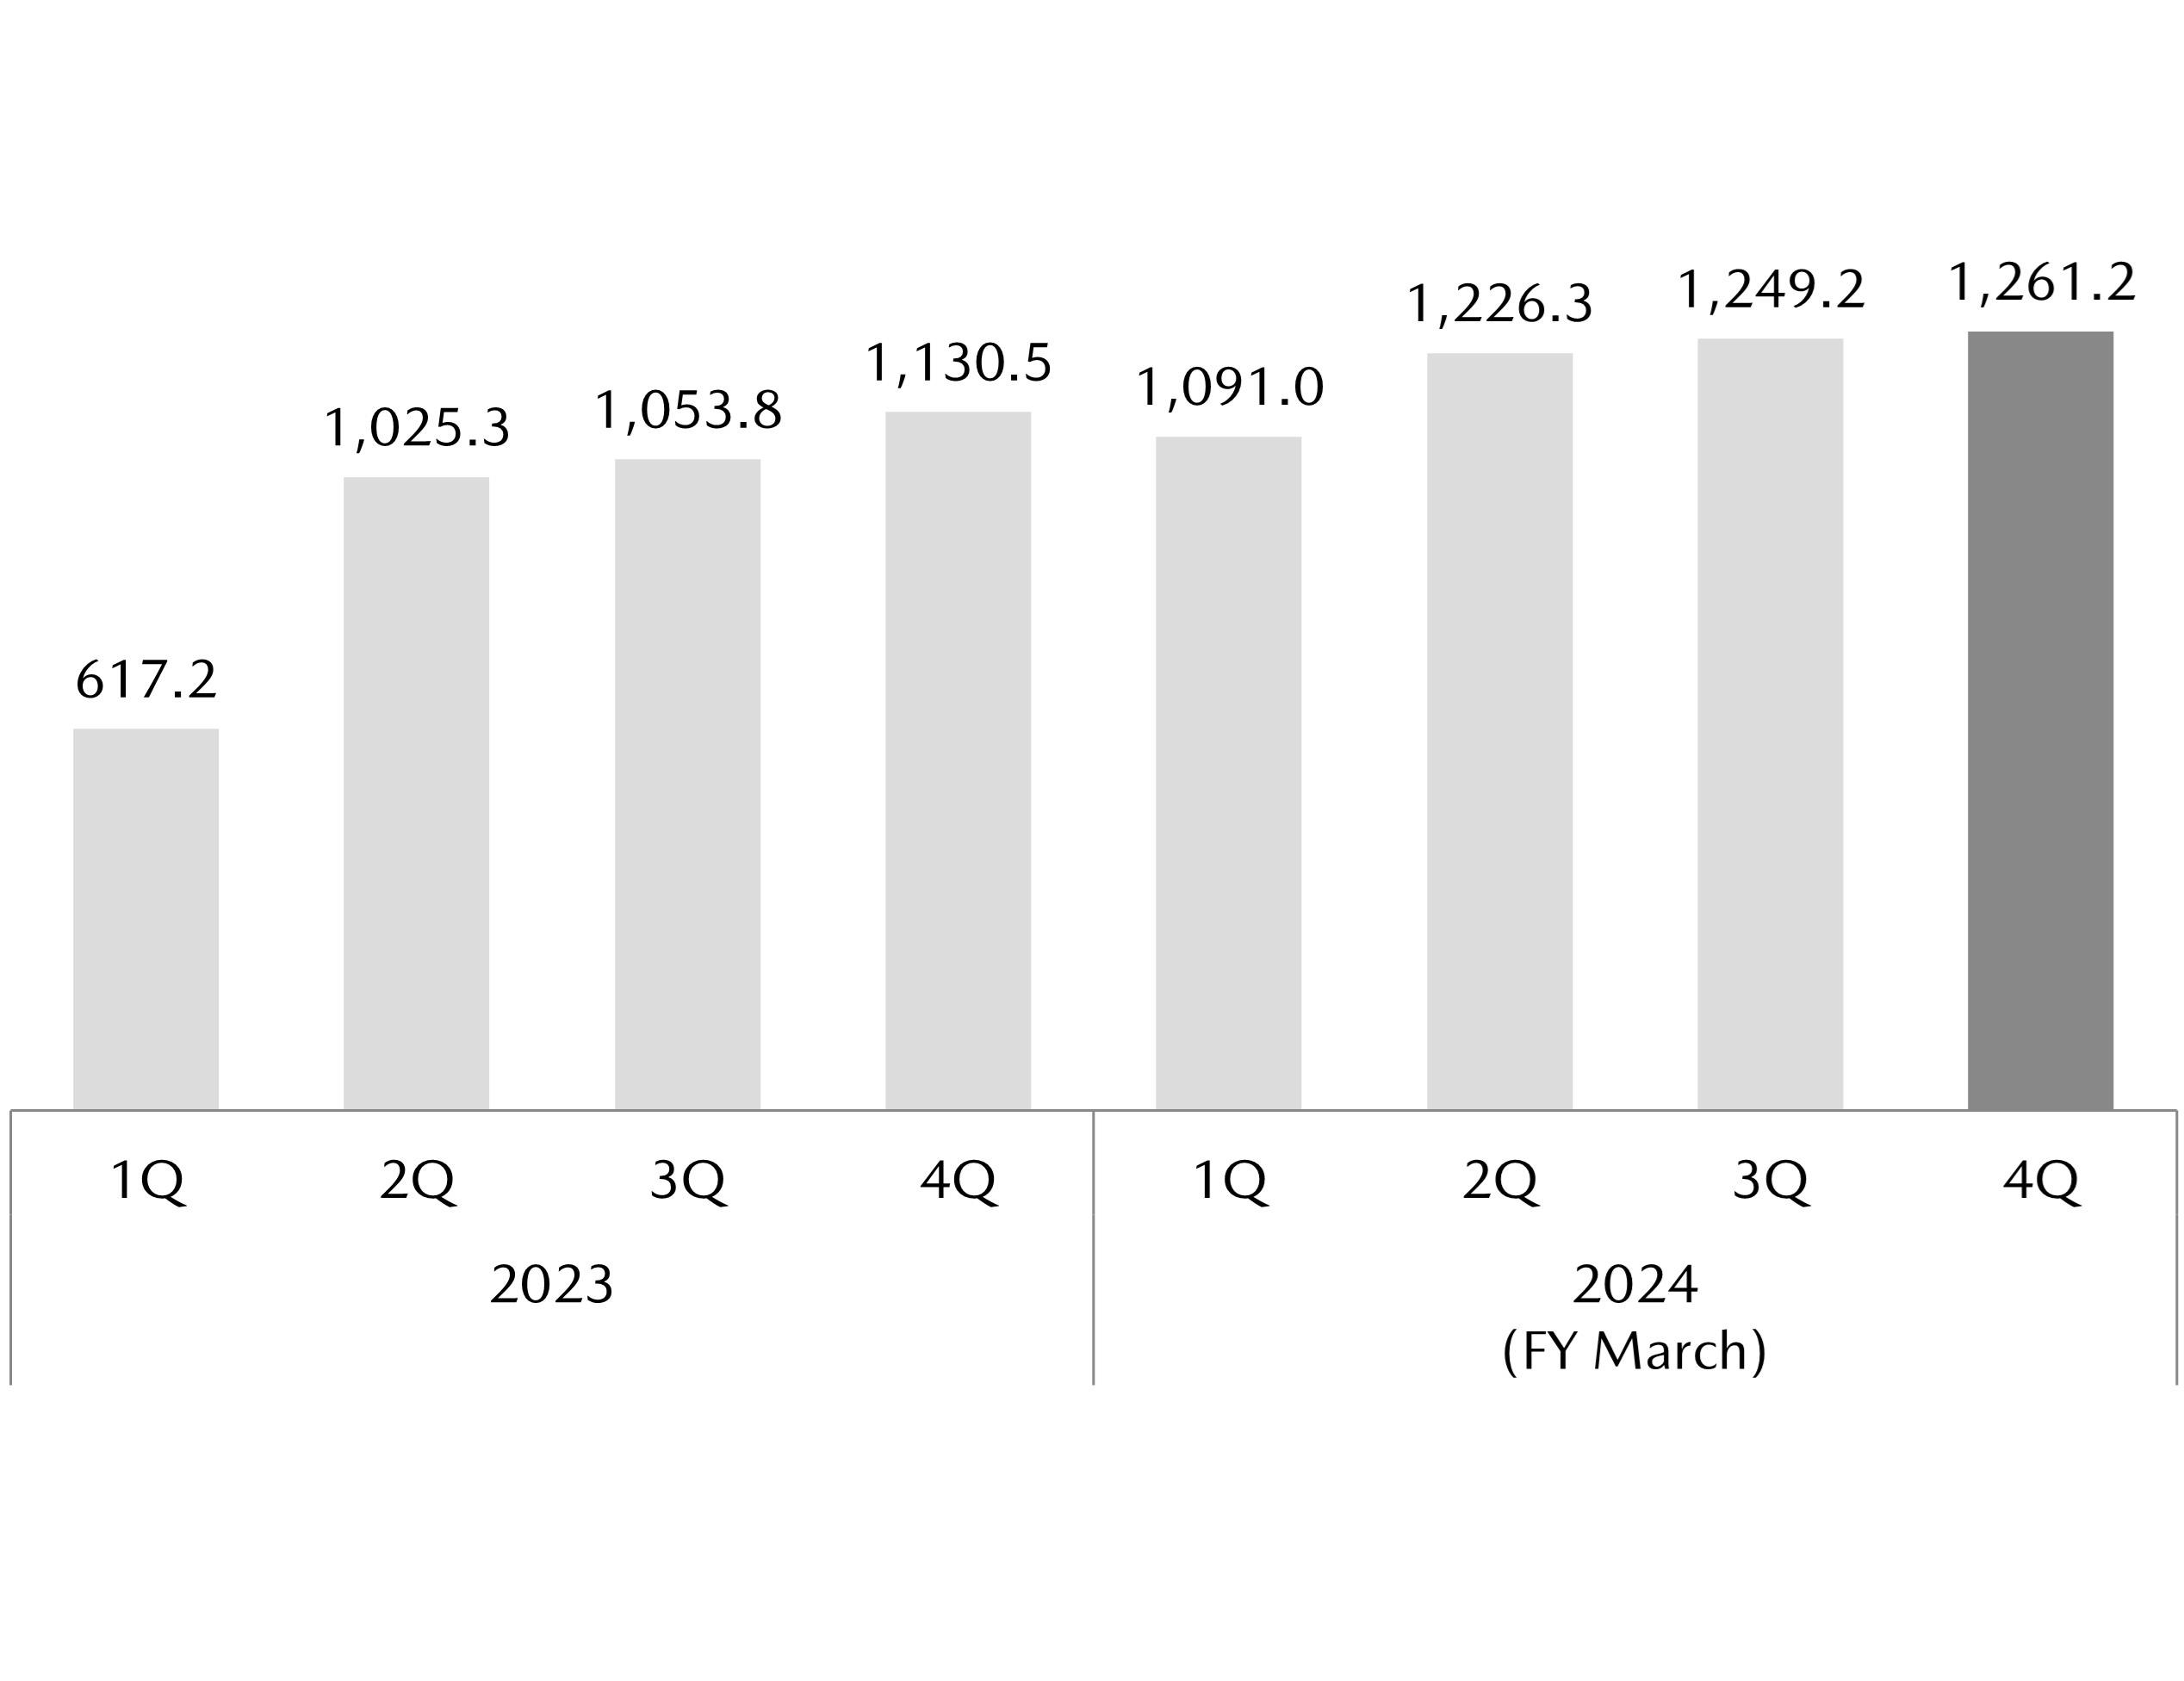
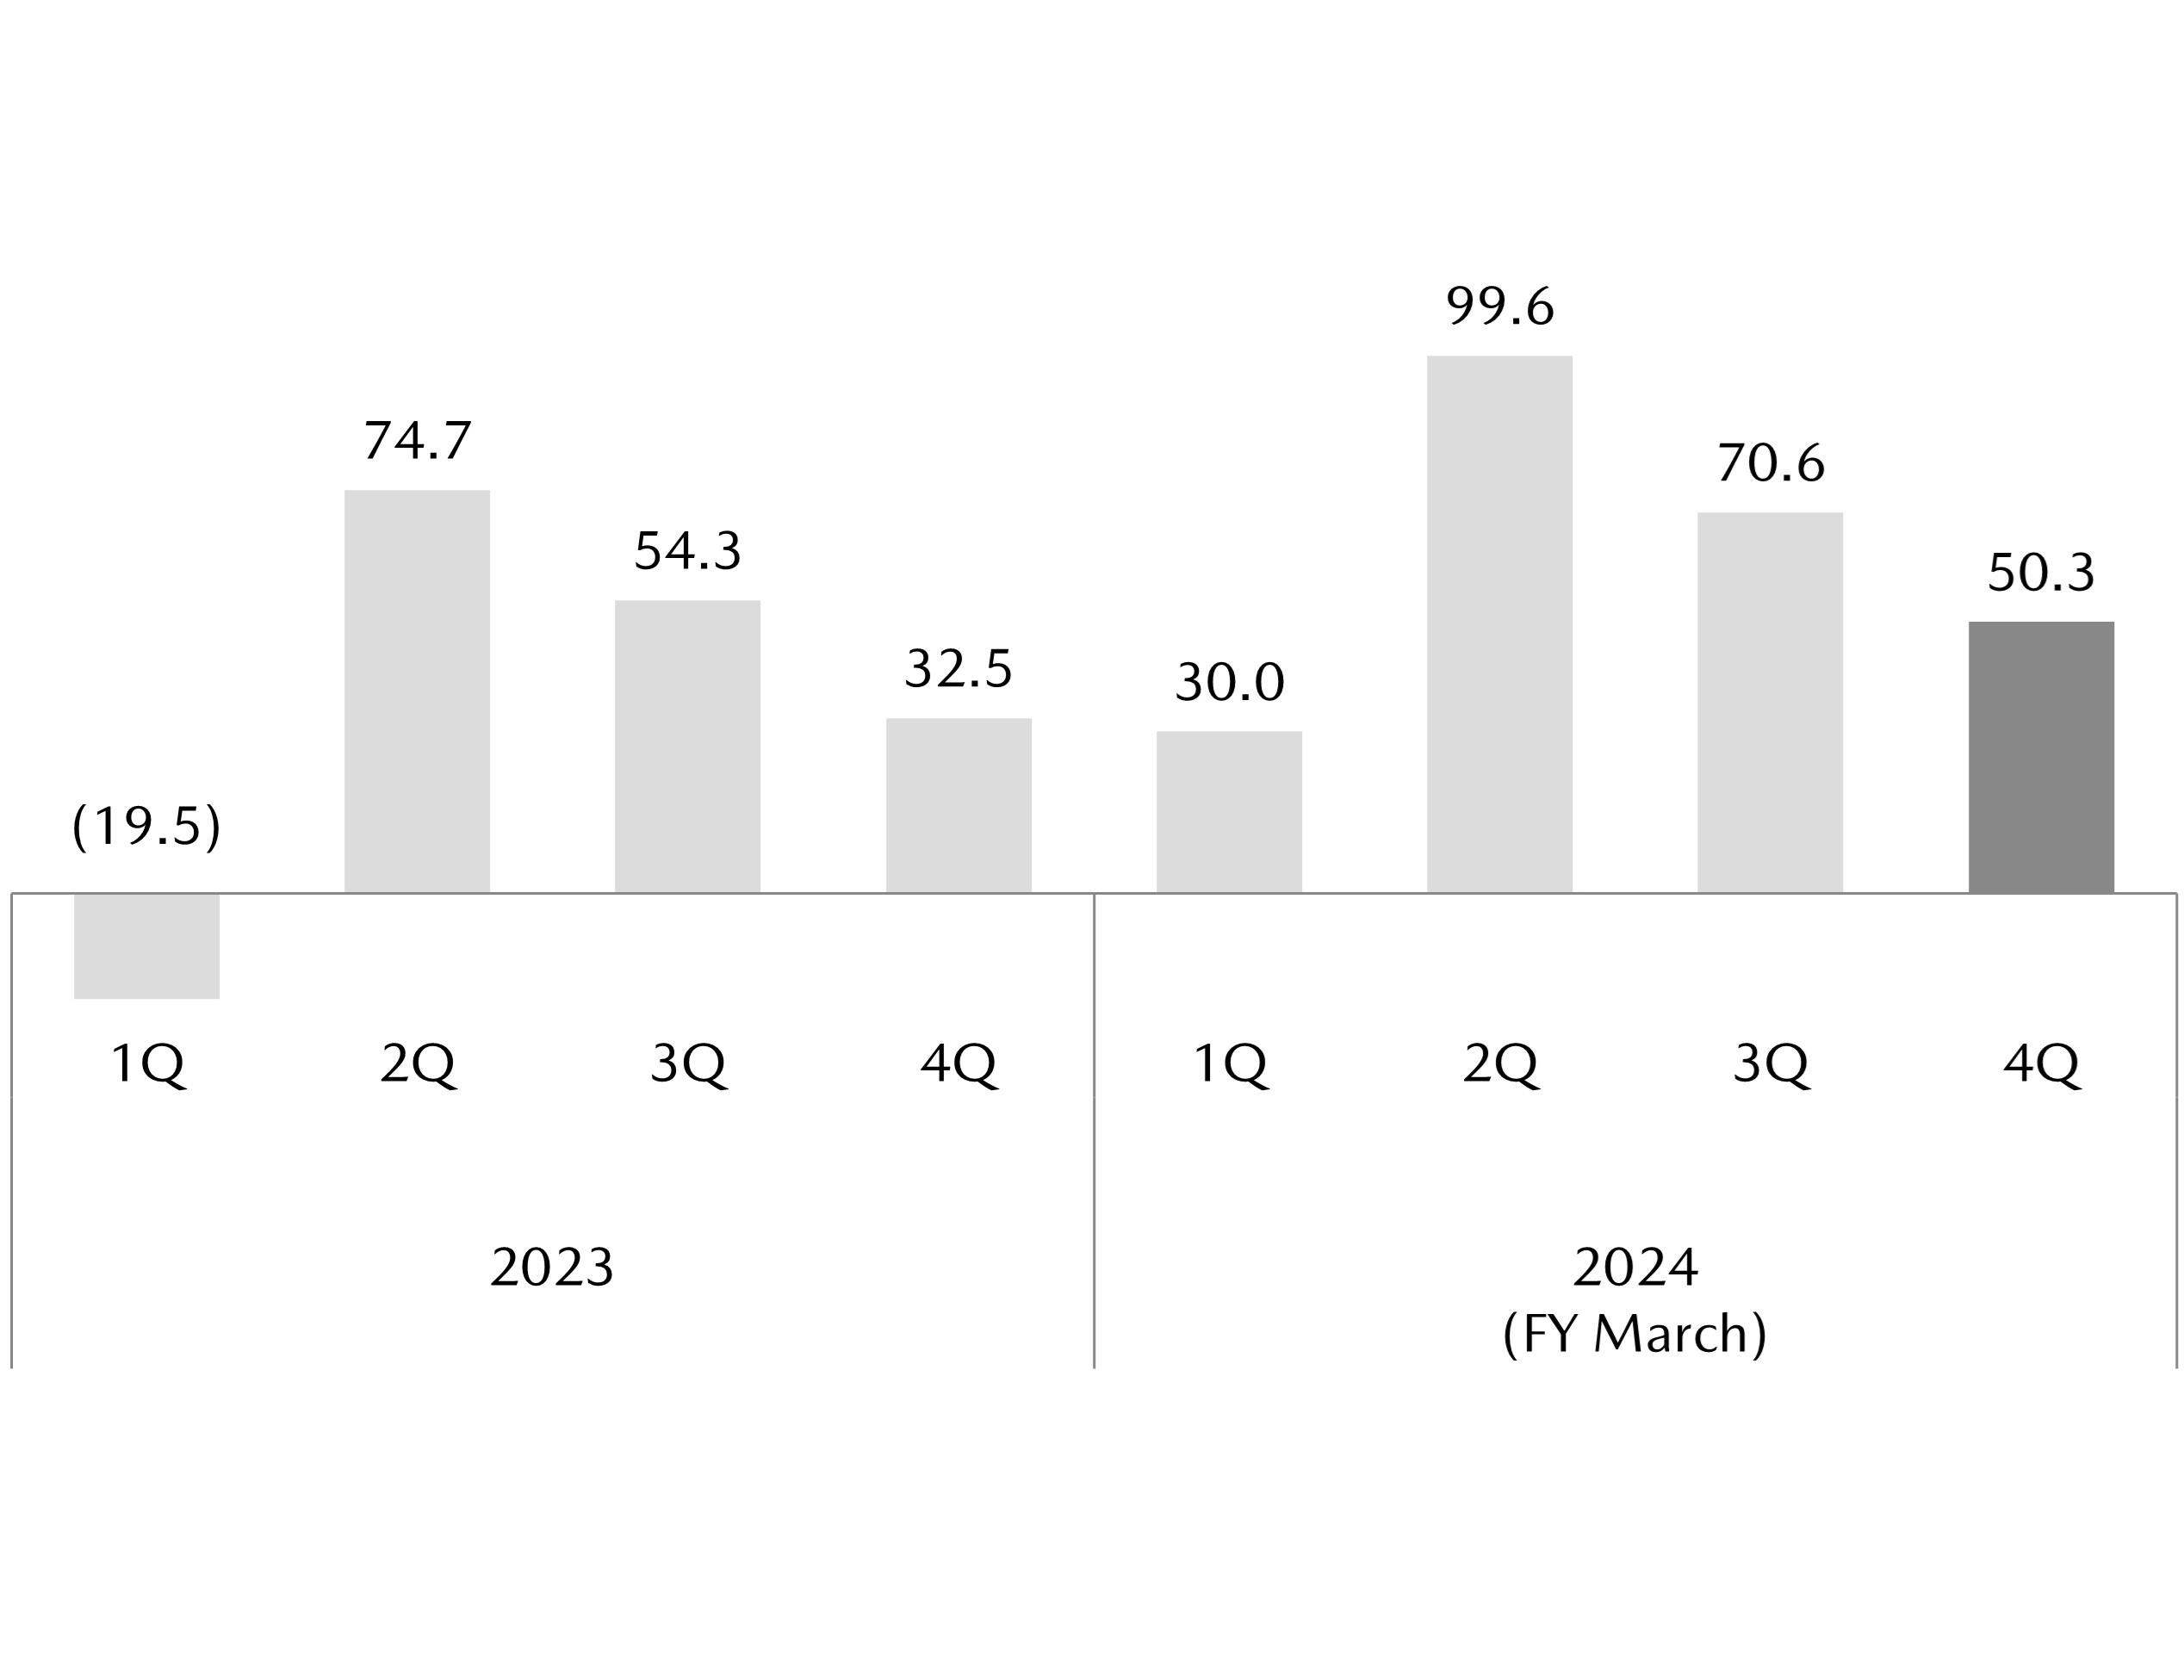
Consolidated wholesale volume was 1,202,000 units, up 13% year on year. Net sales were ¥4,827.7 billion, up 26% from the prior year, operating income was ¥250.5 billion, up 76%, and net income attributable to owners of the parent was ¥207.7 billion, up 45%. We achieved record-high net sales, operating income, and net income attributable to owners of the parent. Operating return on sales was 5.2%.
Average exchange rates for the period were ¥145 to the US dollar, ¥9 weaker from the prior year and ¥157 to the euro, ¥16 weaker from the prior year.
FY March 2025 FORECAST
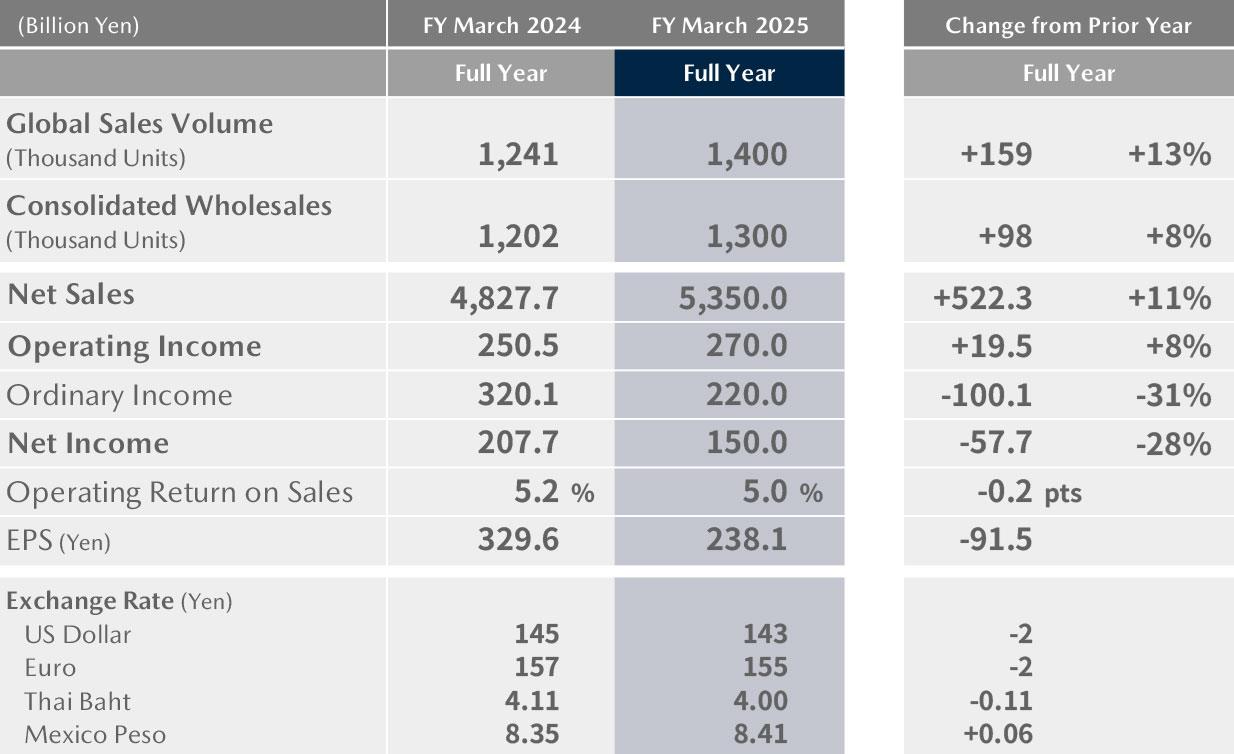
*Net income indicates net income attributable to owners of the parent
For the fiscal year ending March 31, 2025 (April 1, 2024 through March 31, 2025), global sales volume is forecast at 1.4 million units, up 13% year on year. Consolidated wholesale volume is projected at 1.3 million units, up 8% year on year, and the net sales at ¥5,350 billion, up 11% year on year. Operating income is projected to be ¥270 billion, and net income attributable to owners of the parent to be ¥150 billion. Operating return on sales is expected to be 5.0%.
In this fiscal year, we are targeting further top-line growth. In terms of sales, we expect an increase in unit sales, mainly driven by four Large products that are globally available. Operating income is expected to reach a new record high as a result of a further volume growth, especially of Large products, and an improvement in variable profit per unit.
Our exchange rate assumptions are ¥143 to the US dollar, ¥2 stronger from the prior year, and ¥155 to the euro, ¥2 stronger from the prior year.
Graphs displaying results and financial data
Global sales volume (Thousands of Units)
Net Sales (Billions of Yen)
Operating Income
(Billions of Yen)
Net Income Attributable to Owners of the Parent (Billions of Yen)